 Georgia Civic Data
Data story
Georgia school zone boundaries are now in our API
Boundaries for most Georgia public schools, in one format, plus two examples of what they make possible: school spending compared with zone income, and a map of income by zone.
By Georgia Civic Data · October 12, 2026 · Data as of October 12, 2026
We’re excited to announce the addition of school zone boundaries to our API! A school zone is the area a school district uses to assign a home address to a school. We have boundaries for 1,907 public schools, out of 2,070 public schools that should have school zones.1
Each of Georgia’s 180 school districts publishes its school zones differently. We brought them together under one format in our API so users can pull in school zone boundaries as GeoJSON, GeoParquet, or JSON, or download a shapefile as a zip file.
We also have crosswalks between school zones and census tracts and between school zones and block groups. With the crosswalks, users can aggregate census data at the school zone level, not just the school district level.
We’ve already aggregated two pieces of census data and placed them into our API:
- Median and mean household income by school zone
- Population and population density by school zone, for both the total population and the 5- to 17-year-old population
Below are some ways to use this data with the API. They are basic, and we know researchers and analysts can do even more.
The relationship between per-pupil expenditures and median income within a school zone
The scatter plots below examine the relationship between each school’s per-pupil expenditures and the median income of its school zone. There are three: one for total per-pupil expenditures, one for federal expenditures, and one for state/local expenditures.
The spending figures are for fiscal year 2024 (the 2023–24 school year), the incomes come from the Census Bureau’s 2020–2024 American Community Survey, and the zones are those for the 2026–27 school year.

The data shows no clear relationship between state/local expenditures and median income, while federal spending drops as median income rises. That is expected because much federal education funding, such as Title I, is directed to schools that serve more students from low-income families. Taken together, total per-pupil expenditures drop by an average of $195 for every $10,000 increase in median income within a school zone. Accounting for uncertainty, we can be 90% confident that the drop is between $52 and $338.2
The table below shows how this $195 change breaks down between state/local and federal expenditures. It highlights that the association between total per-pupil expenditures and school zone median income is driven by federal per-pupil expenditures.
The federal drop is also large for its size. Federal per-pupil expenditures drop 11% on average for each $10,000 increase in school zone median income.
| Expenditure type | Average per-pupil spending | Change in per-pupil spending for each $10,000 more in zone income | 90% confidence interval |
|---|---|---|---|
| State/local | $13,281 | -$13 | -$135 to $109 |
| Federal | $1,723 | -$182 | -$224 to -$139 |
| Total | $15,004 | -$195 | -$338 to -$52 |
Median household income by school zone
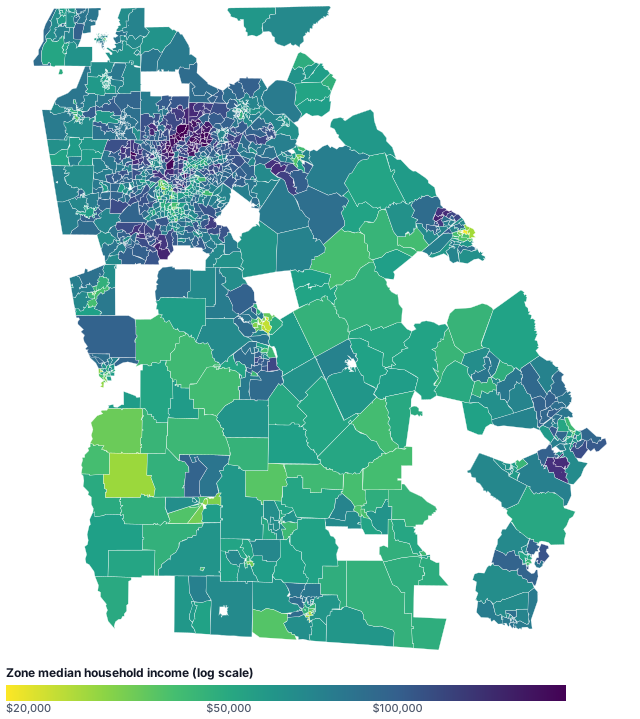
The API also contains the geographic boundaries of school zones, allowing users to map data by school zone. The maps below shade each school zone by its median household income, with one map each for elementary, middle, and high school zones.
School zones show great diversity in their median household incomes. One of the key drivers of this diversity is where a school is located. The typical suburban school zone has a median household income of $89,240, compared with $69,025 for rural zones, $60,504 for city zones, and $56,754 for town zones.3
There is still diversity, however, within large metro school districts. Within the Cobb County School District, where all high schools are suburban, high school zones have median incomes ranging from $77,486 to $176,652. Enter “Cobb County” as the district to see for yourself.
The documentation provides more information on school zones
Compiling and serving school zones is our most ambitious project to date. It required a school district–centric approach since each of Georgia’s 180 school districts is different in how it shares school zones with the public. To confuse matters further, public school students don’t always attend the school in their school zone. School zones serve only as defaults.
These are important considerations when working with our school zone data. Don’t worry if it sounds overwhelming; we’ve got you covered. You can view more information on how school zones work through the following doors:
- Read, or have your agent read, our human-readable explanation
- Fetch our API route explaining school zones at
/api/v1/education/school_attendance_zones/attendance_rules - Ask our MCP server questions about school zones
Just browse the documentation, or send your agent to browse it, to get up to speed on all the details so you can faithfully use the data.
Sources
- School Zone Household Income: Georgia Civic Data dataset
education/school_zone_income, contract version 1.1.0; data retrieved 2026-10-12. - Per-Pupil Expenditure (FESR): Georgia Civic Data dataset
education/per_pupil_expenditure, contract version 1.0.0; data retrieved 2026-10-12. - School attendance zones: Georgia Civic Data geometry topic
education/school_attendance_zones, version 1.0.0; shapes retrieved 2026-10-12 and simplified for display; school zone status table retrieved 2026-10-12. - Schools: Georgia Civic Data
schoolsdimension; retrieved 2026-10-12.
Lea esta historia en español · Markdown en español
Data Stories AI Use Policy
Writing: We, humans, do all the writing. We use LLMs to proofread drafts and fix grammar and spelling mistakes. We brainstorm with LLMs on idea and topic generation, and how to best analyze the data in a story.
Translation: We write each story in English and use an LLM to translate it into Spanish.
Coding: We use LLM coding assistants to write the code for an analysis once we, with the help of an LLM, decide how to best conduct the analysis.